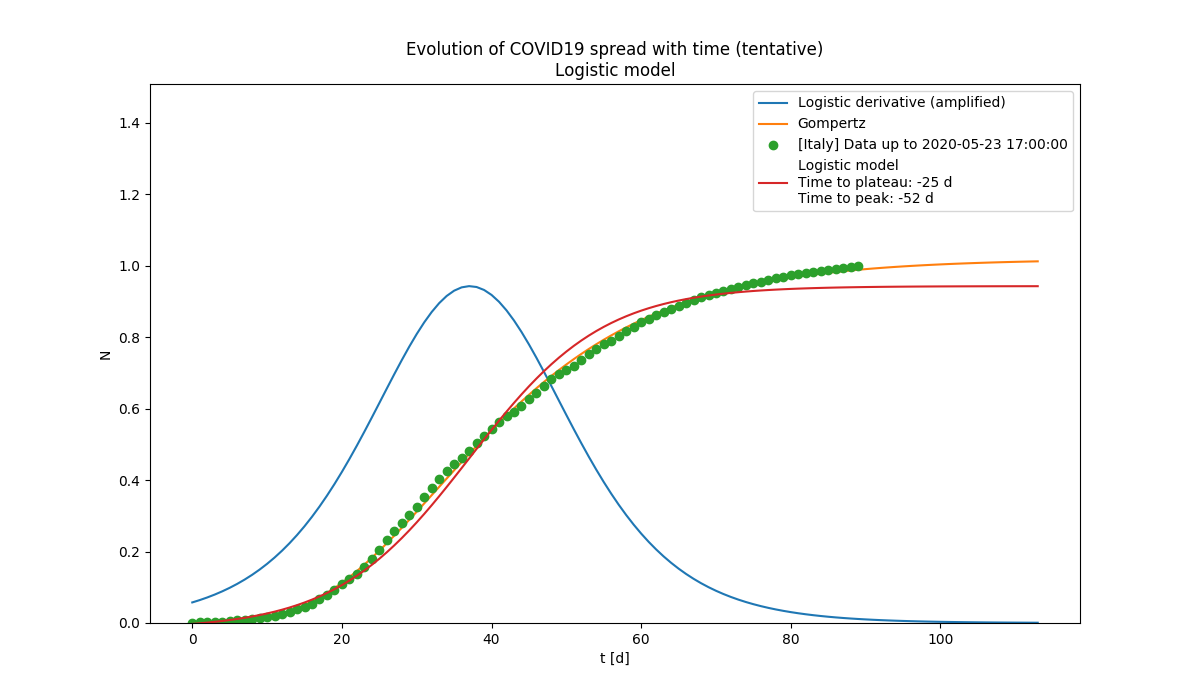
 Observed and estimated evolution of the spread. The estimated time to plateau is shown.
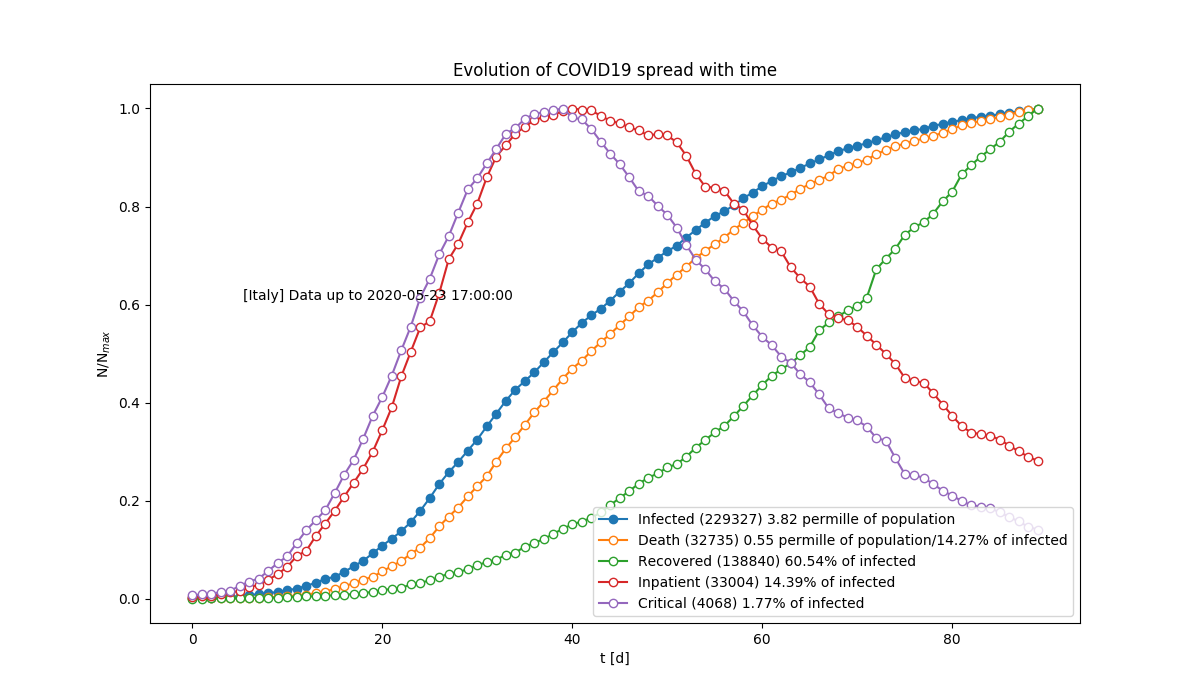 Relative growth of different categories of people. Data are normalised at their maximum.
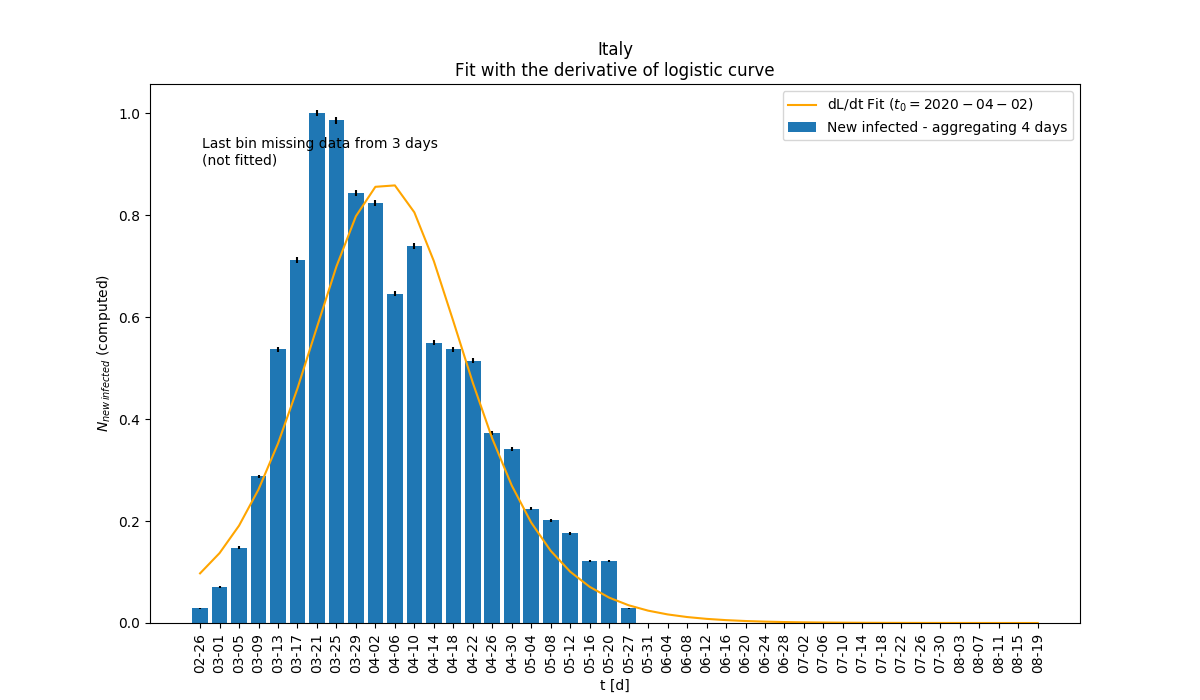 New infected as a function of time. Data are aggregated on few days to absorb random fluctuations.
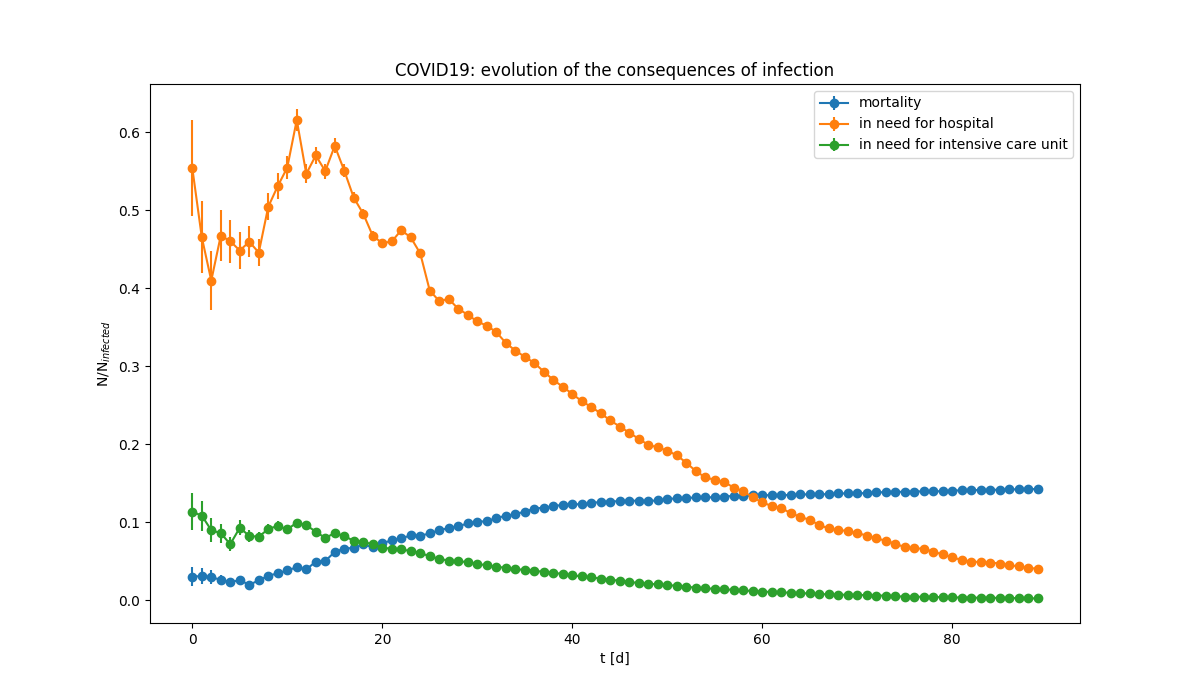 Evolution of the consequences of the infection. Almost half of infected need to be hospitalized, about 10% requires intensive care. The fraction of those who die is slowly increasing (Note: ratio are computed relative to infected people, not to popoluation).
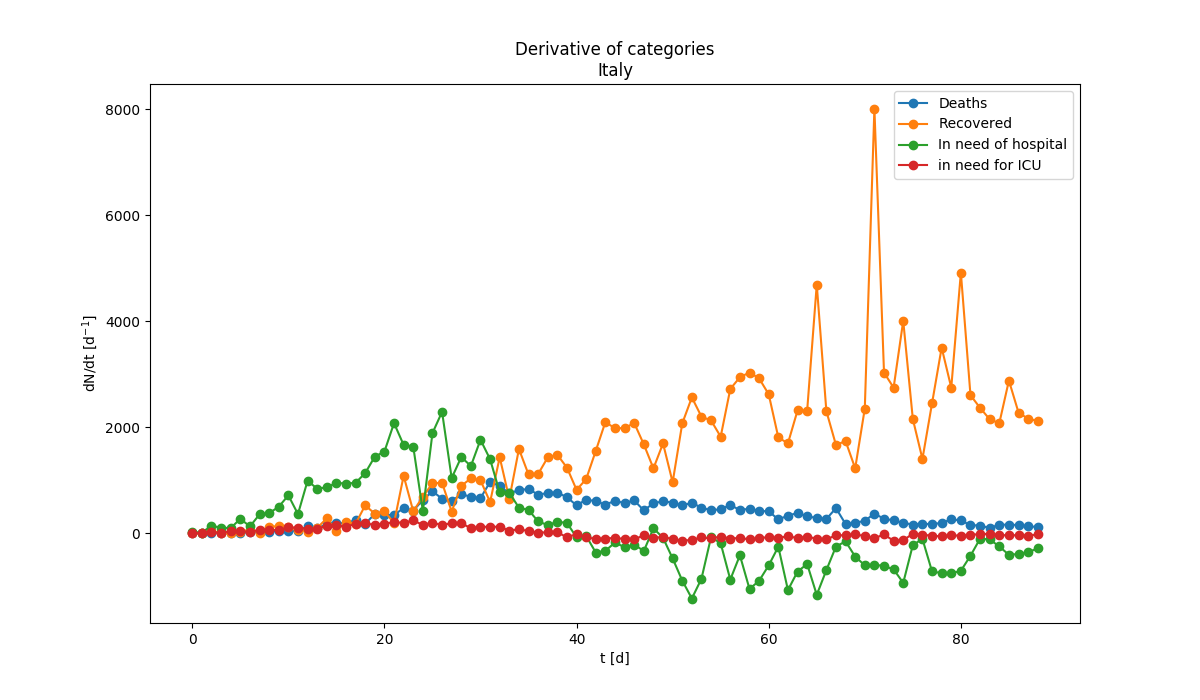 Derivative of the evolution of the infection for various categories. The derivative is the chnage of the number of people in the category divided by the time.
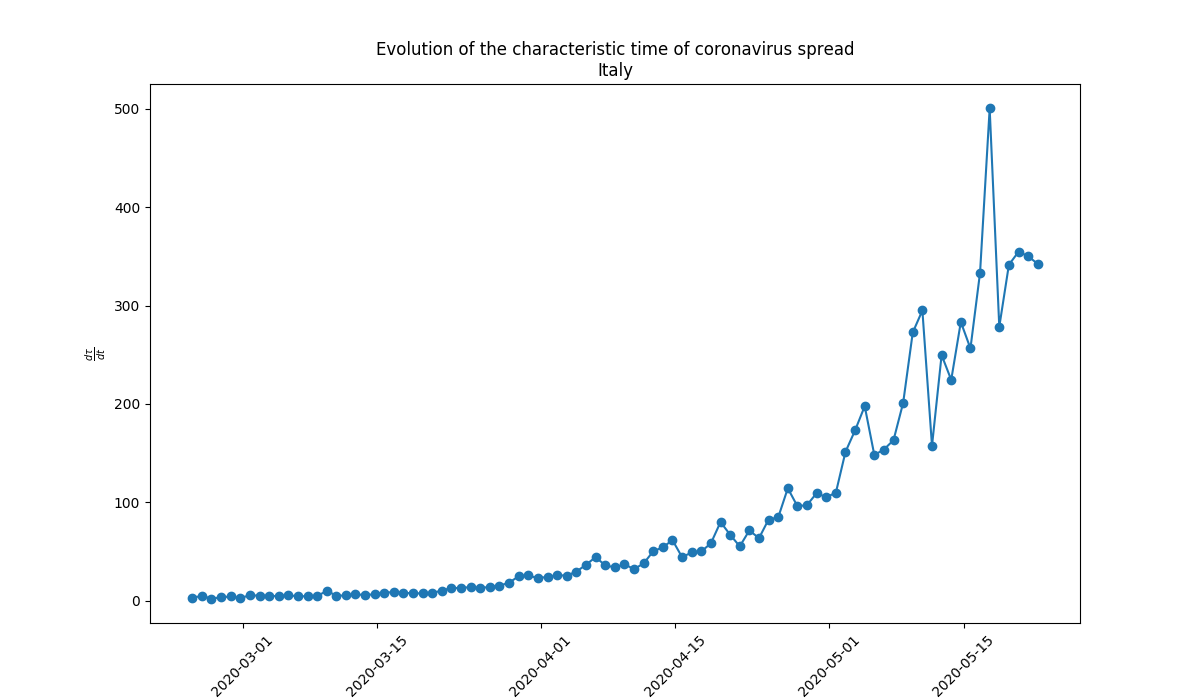 Evolution of the derivative of the number of infected people with time. Evolution of the derivative of the number of infected people with time. |
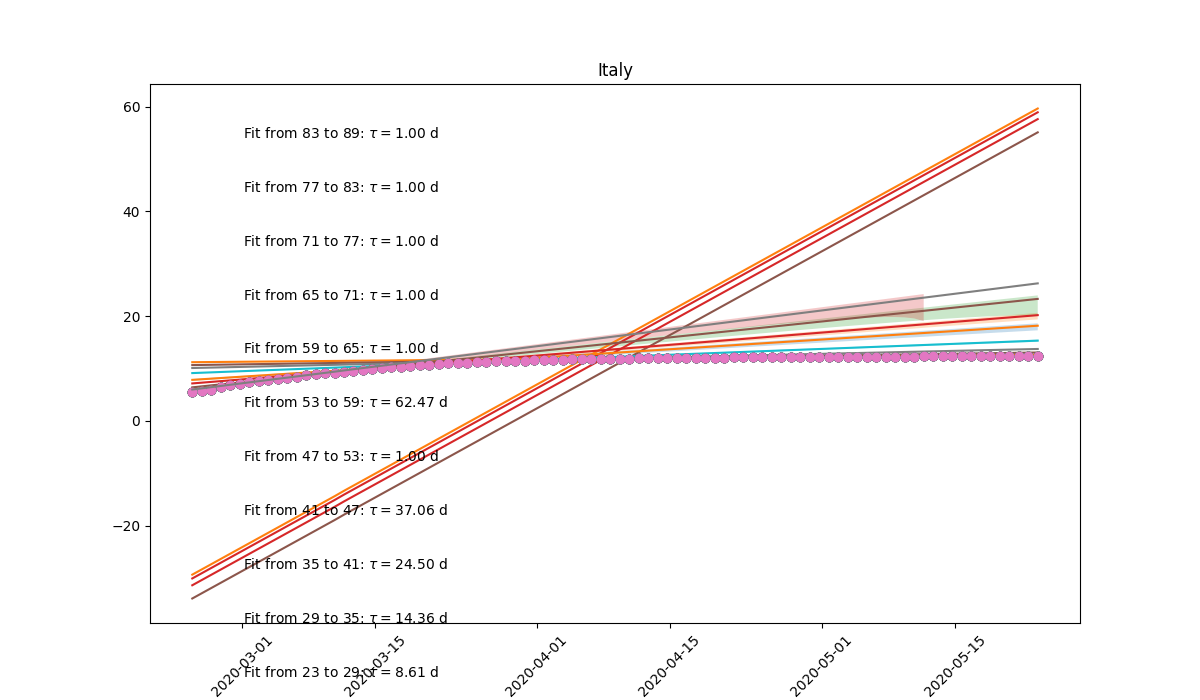 Exponential growth of infected people as a function of time. Rise time estimated in different time windows. |
Simulation of the outbreak: 500 individuals in a square 80x80. When they meet there is a 75% probability of infecting others if infected. Ecah infected individual has a probability of 4.5% to die, but it recovers after 150 steps, on average. Once recovered it cannot be infected. With 500 individuals the final population after 1000 iterations is of 360, all infected. |
Simulation of the outbreak: 50 individuals in a square 80x80. When they meet there is a 75% probability of infecting others if infected. Ecah infected individual has a probability of 4.5% to die, but it recovers after 150 steps, on average. Once recovered it cannot be infected. With 50 individuals the final population after 1000 iterations is still of 50, nobody died. |
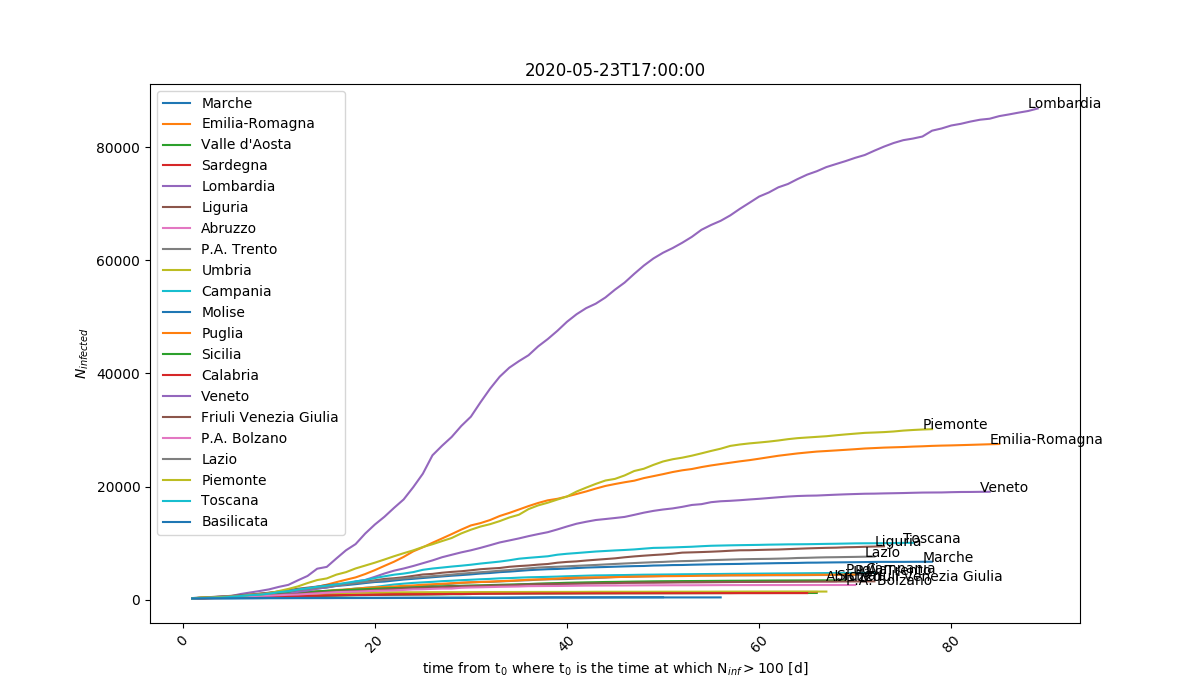
Comparison between different regions. t=0 is when each region reached N>100 infected.
|
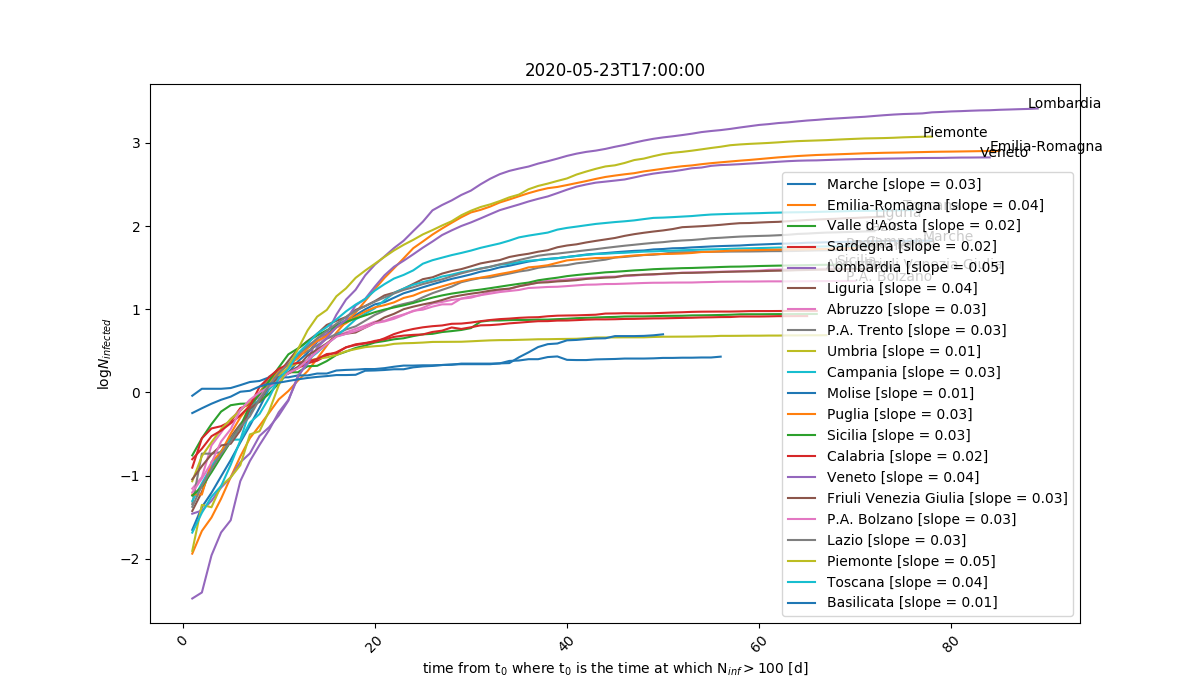
Comparison between different regions in log scale and relative to the maximum number of infected people reached in each of them. t=0 is when each region reached N>100 infected. The higher the slope, the faster the infection spread.
|
